I spent some time this week adding a feature to the Geekbench Browser that I think a lot of you will find useful — performance charts.
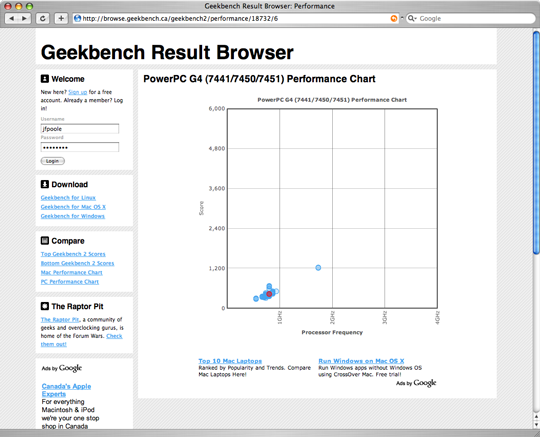
Performance charts display the scores (plotted against processor speed) for a certain subset of results in the Geekbench Browser (say, all of the results that share a particular processor or motherboard). This makes it easy to compare your computer’s performance against other, similar, computers. If you’re curious about a particular point on the chart, you can click on it and view the complete result details for that point.
Performance charts are accessed by clicking on any one of the “Chart Performance” links you see on individual result pages in the Geekbench Browser. Keep in mind that depending on how many results match the criteria of the performance chart it may take a while to load the chart, so please be patient.
Give the new performance charts a try and let me know what you think of them in the Geekbench forum.