Since this is my first post I’d like to begin by introducing myself. My name is Anthony Schmieder and I’m a software developer here at Primate Labs. I joined the team in the spring. I want to share some of the details of my first project at Primate Labs. A key goal for Geekbench 3 was to improve cross-platform comparability of the scores. To ensure that we did not lose sight of this goal as development ramped up, we needed an automated system to compare the scores across platforms and provide immediate feedback as we developed the workloads. I was able to quickly develop this system using Pulse, Python, and matplotlib.
First, we already used the Pulse continuous integration server to build Geekbench and run our test scripts after each commit to our development branch. Our Pulse build servers are three Mac minis with identical hardware. One runs OS X, one runs Linux, and one runs Windows. Since Geekbench is a processor benchmark and not a system benchmark, we wanted Geekbench scores to be similar across operating systems when run on identical hardware. There will always be some variation between operating systems, but our goal was to understand the sources of the variation and minimize those sources when possible. The build servers were a convenient place to test this, so I added a step to the Pulse builds that runs Geekbench on each server and exports the results to JSON using the –save option of the Geekbench command line tool.
Next, I wrote a Python script to read the Geekbench results for each platform, compare them, and generate a set of reports using matplotlib. The reports highlighted the differences in Geekbench scores across platforms and guided our investigations into performance and scoring issues. Of all the reports, the one we used most frequently compares the relative execution time of each workload across all platforms. A report for 32-bit single-core performance is shown below:
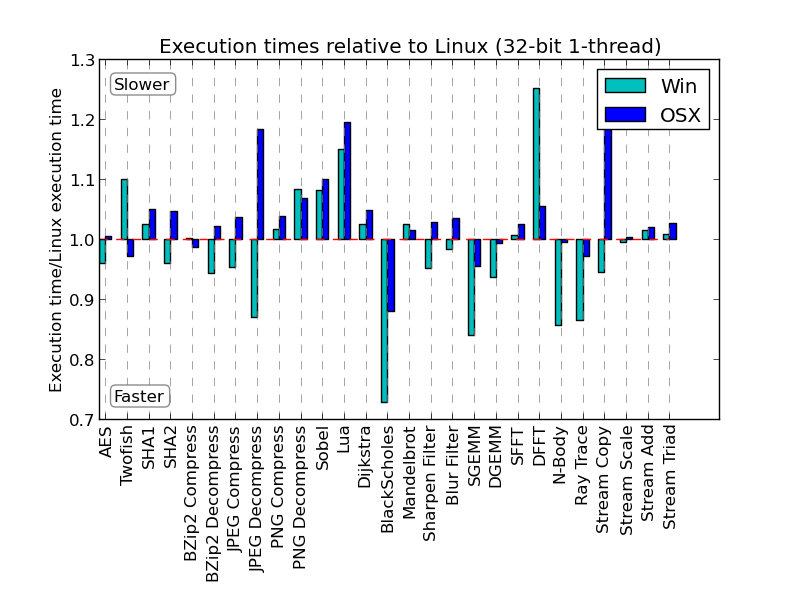
After each commit that affected workload code we examined this report, investigated any workloads that appeared problematic, analyzed the issues, fixed them if possible, committed those fixes, and repeated. For example, in the above report we see discrepancies in Black-Scholes and Stream Copy. For Black-Scholes, Visual C++ has optimized calls to sqrtf in the standard math library into sqrtps and sqrtss instructions. In the Stream Copy workload, the Clang and GCC optimizers have replaced the stream copy with a call to _memcpy.
Using this report we eliminated many other issues such as loop unrolling issues in the AES and Sobel workloads and vectorization issues in the GEMM workload. In AES, text is processed in chunks. Each chunk is transformed ten times and each transformation uses a different precomputed key. On systems with AES-NI instructions, this is implemented by the loop:
scratch = _mm_xor_si128(scratch, ((__m128i*)ctx->schedule)[0]);
for (int j = 1; j < 10; j++) {
  scratch = _mm_aesenc_si128(scratch, ((__m128i*)ctx->schedule)[j]);
}
This loop is unrolled by Clang and GCC. Visual C++, however, is conservative about unrolling loops that contain compiler intrinsics, so it did not unroll the loop. This led to a 25% performance penalty for MSVC. We worked around this issue by unrolling the loop by hand:
scratch = _mm_xor_si128(scratch, ((__m128i*)ctx->schedule)[0]);
scratch = _mm_aesenc_si128(scratch, ((__m128i*)ctx->schedule)[1]);
scratch = _mm_aesenc_si128(scratch, ((__m128i*)ctx->schedule)[2]);
The report helped us uncover another interesting loop unrolling issue in our Sobel workload. Using Clang and GCC we saw a slight performance increase by running the benchmark in 64-bit mode instead of 32-bit mode. In Visual C++ we saw a 50% drop in performance when running in 64-bit mode. With help from the Visual C++ team at Microsoft, we were able to track the issue to a difference between the 32-bit and 64-bit loop unrolling heuristics in Visual C++. Again, we worked around the issue by unrolling the loop by hand.
The last issue I’ll talk about was in our GEMM kernel. We had code similar to the following where A, B, and C all have type float**:
for (unsigned i = 0; i < N; i ++) {
  for (unsigned j = 0; j < N; j ++) {
    for (unsigned k = 0; k < N; k ++) {
      C[i][j] += A[i][k] * B[j][k];
    }
  }
}
Clang and GCC vectorized the inner loop over k, but Visual C++ refused. The issue was that VC++ could not vectorize over the second level of indirection on the float** arrays. We worked around this issue by removing the first level of indirection:
for (unsigned i = 0; i < N; i ++) {
  for (unsigned j = 0; j < N; j ++) {
    float *x = A[i];
    float *y = B[j];
    for (unsigned k = 0; k < N; k ++) {
      C[i][j] += x[k] * y[k];
    }
  }
}
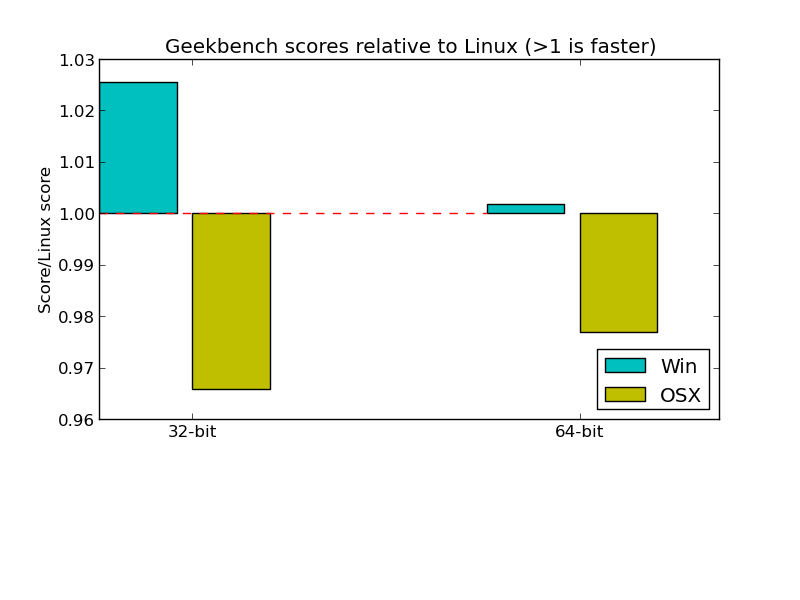
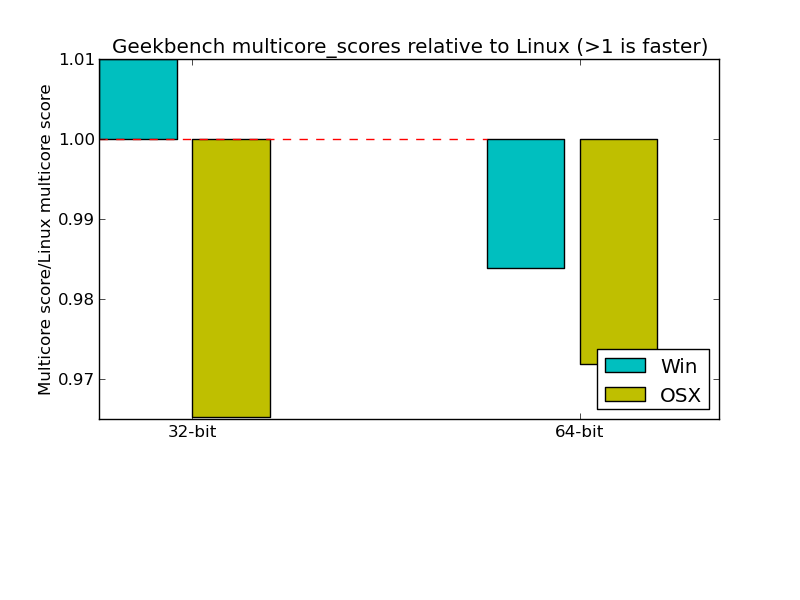
While we were unable to eliminate all of the performance differences between platforms, the automated performance reports helped us verify that there were no systemic issues affecting either Windows, Linux, or OS X performance. That, along with the large variety of different workloads in Geekbench 3, resulted in overall scores that vary by less than 5% across platforms:
These reports have become an important part of our development process. They helped us to quickly locate performance issues in new workloads and avoid performance regressions in updated workloads. Automating the generation of these reports was key to their usefulness. If the manual effort to check for performance issues was large, then so would be the temptation to postpone cross-platform performance verification. As correcting these issues often took several days and sometimes required offsite correspondences to verify compiler optimization issues, learning about the issues quickly was critical.